Working with Python in Visual Studio Code, using the Microsoft Python extension, is simple, fun, and productive. The extension makes VS Code an excellent IDE, and works on any operating system with a variety of Python interpreters. It leverages all of VS Code's power to provide auto complete and IntelliSense, linting, debugging, and unit testing, along with the ability to easily switch between Python environments, including virtual and conda environments.
This article provides only an overview of the different capabilities of the Python extension for VS Code. For a walkthrough of editing, running, and debugging code, use the button below.
The tutorial guides you through installing Python and using the extension. You must install a Python interpreter yourself separately from the extension. For a quick install, use Python 3.6 from python.org and install the extension from the VS Code marketplace.
Once you have a version of Python installed, activate it using the Python: Select Interpreter command. If VS Code doesn't automatically locate the interpreter you're looking for, refer to Environments - Manually specify an interpreter.
You configure the Python extension through settings. See the Settings reference.
To experience Python, create a file (using the File Explorer) named hello.py and paste in the following code (assuming Python 3):
print("Hello World")
The Python extension then provides shortcuts to run Python code in the currently selected interpreter (Python: Select Interpreter in the Command Palette):
You can also use the Terminal: Create New Integrated Terminal command to create a terminal in which VS Code automatically activates the currently selected interpreter. See Environments below. The Python: Start REPL activates a terminal with the currently selected interpreter and then runs the Python REPL.
For a more specific walkthrough on running code, see the tutorial.
The Python extension supports code completion and IntelliSense using the currently selected interpreter. IntelliSense is a general term for a number of features, including intelligent code completion (in-context method and variable suggestions) across all your files and for built-in and third-party modules.
IntelliSense quickly shows methods, class members, and documentation as you type, and you can trigger completions at any time with ⌃Space (Windows, Linux Ctrl+Space). You can also hover over identifiers for more information about them.
Tip: Check out the IntelliCode extension for VS Code (preview). IntelliCode provides a set of AI-assisted capabilities for IntelliSense in Python, such as inferring the most relevant auto-completions based on the current code context.
Linting analyzes your Python code for potential errors, making it easy to navigate to and correct different problems.
The Python extension can apply a number of different linters including Pylint, Pep8, Flake8, mypy, pydocstyle, prospector, and pylama. See Linting.
No more print statement debugging! Set breakpoints, inspect data, and use the debug console as you run your program step by step. Debug a number of different types of Python applications, including multi-threaded, web, and remote applications.
For Python-specific details, including setting up your launch.json configuration and remote debugging, see Debugging. General VS Code debugging information is found in the debugging document. The Django and Flask tutorials also demonstrate debugging in the context of those web apps, including debugging Django page templates.
Snippets take productivity to the next level. You can configure your own snippets and use snippets provided by an extension. Snippets appear in the same way as code completion ⌃Space (Windows, Linux Ctrl+Space). For specific examples with Python, see the Django and Flask tutorials.
The Python extension automatically detects Python interpreters that are installed in standard locations. It also detects conda environments as well as virtual environments in the workspace folder. See Configuring Python environments. You can also use the python.pythonPath setting to point to an interpreter anywhere on your computer.
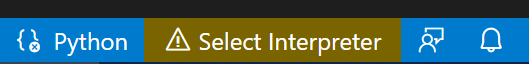
The current environment is shown on the left side of the VS Code Status Bar:

The Status Bar also indicates if no interpreter is selected:
The selected environment is used for IntelliSense, auto-completions, linting, formatting, and any other language-related feature other than debugging. It is also activated when you use run Python in a terminal.
To change the current interpreter, which includes switching to conda or virtual environments, select the interpreter name on the Status Bar or use the Python: Select Interpreter command.
VS Code prompts you with a list of detected environments as well as any you've added manually to your user settings (see Configuring Python environments).
Packages are installed using the Terminal panel and commands like pip install <package_name> (Windows) and pip3 install <package_name> (macOS/Linux). VS Code installs that package into your project along with its dependencies. Examples are given in the Python tutorial as well as the Django and Flask tutorials.
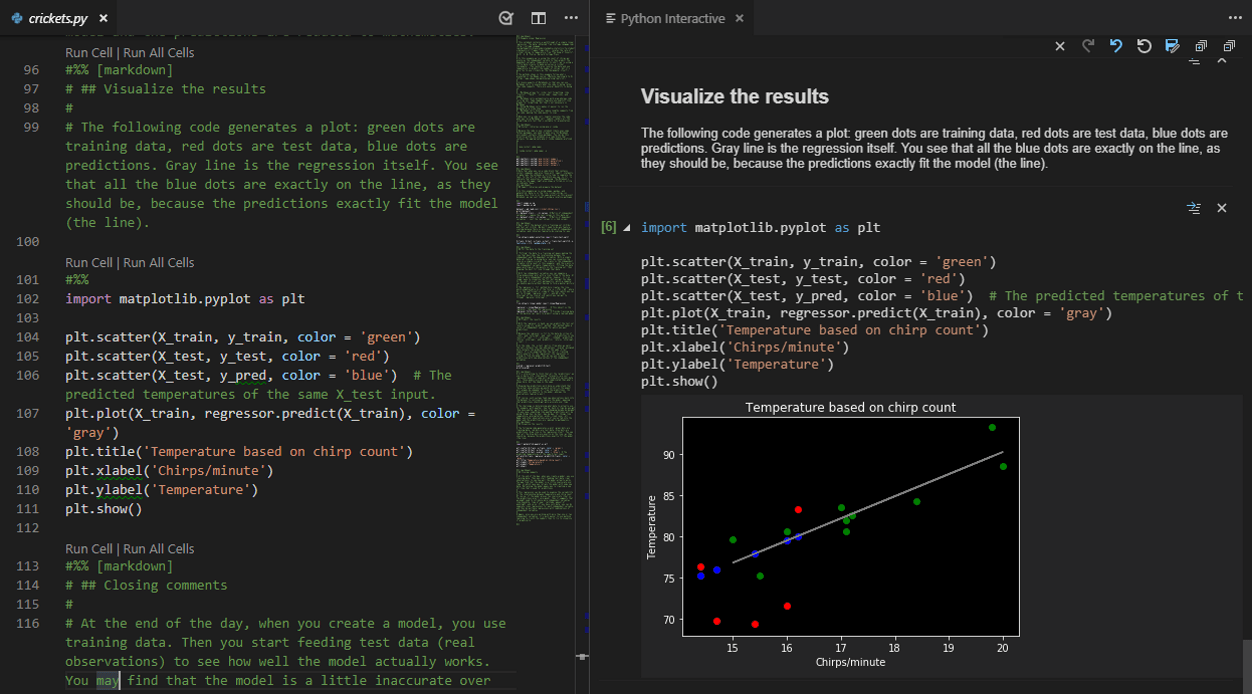
If you open a Jupyter notebook file (.ipynb) in VS Code, the Python extension prompts you to import the notebook as a Python code file. The notebook's cells are delimited in the Python file with #%% comments, and the Python extension shows Run Cell or Run All Cells CodeLens. Selecting either CodeLens starts the Jupyter server and runs the cell(s) in the Python interactive window:
You can also connect to a remote Jupyter server for running the code.
Furthermore, importing a notebook into VS Code allows you to use all of VS Code's debugging capabilities. You can then save the notebook file and open it again as a notebook in Jupyter or upload to a service like Azure Notebooks.
For more information, see Jupyter support.
The Python extension supports unit testing with the unittest, pytest, and nose test frameworks.
To run unit tests, you enable one of the frameworks in settings. Each framework also has specific settings, such as arguments that identify paths and patterns for test discovery.
Once discovered, VS Code provides a variety of commands (on the Status Bar, the Command Palette, and elsewhere) to run and debug tests, including ability to run individual test files and individual methods.
The Python extension provides a wide variety of settings for its various features. These are described on their relevant topics, such as Editing code, Linting, Debugging, and Unit Testing. The complete list is found in the Settings reference.
The Microsoft Python extension provides all of the features described previously in this article. Additional Python language support can be added to VS Code by installing other popular Python extensions. For Jupyter support, we recommend the "Jupyter" extension from Don Jayamanne.
The extensions shown above are dynamically queried. Click on an extension tile above to read the description and reviews to decide which extension is best for you. See more in the Marketplace.
In this tutorial, you use Python 3 to create the simplest Python "Hello World" application in Visual Studio Code. By using the Python extension, you make VS Code into a great lightweight Python IDE (which you may find a productive alternative to PyCharm).
This tutorial is intended to introduce you to VS Code as a Python environment, primarily how to edit, run, and debug code. This tutorial is not intended to teach you Python itself. Once you are familiar with the basics of VS Code, you can then follow any of the programming tutorials listed on python.org within the context of VS Code for an introduction to the language.
If you have any problems, feel free to file an issue for this tutorial in the VS Code documentation repository.
Note: You can use VS Code with Python 2 with this tutorial, but you need to make appropriate changes to the code, which are not covered here.
To successfully complete this tutorial, complete the following requirements:
Install the Python extension for VS Code. For details on installing extensions, see Extension marketplace. The Python extension is named Python and published by Microsoft.
Install a version of Python 3 (for which this tutorial is written). Options include:
pip with get-pip.py.brew install python3 (the system install of Python on macOS is not supported).Note You can use the
py -0command in the integrated terminal to view the versions of python installed on your machine. The default interpreter is identified by an asterisk (*).
On MacOS, make sure the location of your VS Code installation is included in your PATH environment variable. See the setup instructions for more information.
At a command prompt or terminal, create an empty folder called "hello", navigate into it, and open VS Code (code) in that folder (.) by entering the following commands:
mkdir hello
cd hello
code .
By starting VS Code in a folder, that folder becomes your "workspace". VS Code stores settings that are specific to that workspace in .vscode/settings.json, which are separate from user settings that are stored globally.
Alternately, you can run VS Code through the operating system UI, then use File > Open Folder to open the project folder.
Python is an interpreted language, and in order to run Python code and get Python IntelliSense, you must tell VS Code which interpreter to use.
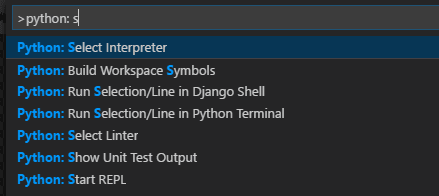
From within VS Code, select a Python 3 interpreter by opening the Command Palette (⇧⌘P (Windows, Linux Ctrl+Shift+P)), start typing the Python: Select Interpreter command to search, then select the command. You can also use the Select Python Environment option on the Status Bar if available (it may already show a selected interpreter, too):

The command presents a list of available interpreters that VS Code can find automatically, including virtual environments. If you don't see the desired interpreter, see Configuring Python environments.
Selecting an interpreter sets the python.pythonPath value in your workspace settings to the path of the interpreter. To see the setting, select File > Preferences > Settings (Code > Preferences > Settings on macOS), then select the Workspace Settings tab.
Note: If you select an interpreter without a workspace folder open, VS Code sets
python.pythonPathin your user settings instead, which sets the default interpreter for VS Code in general. The user setting makes sure you always have a default interpreter for Python projects. The workspace settings lets you override the user setting.
From the File Explorer toolbar, click the New File button on the hello folder:
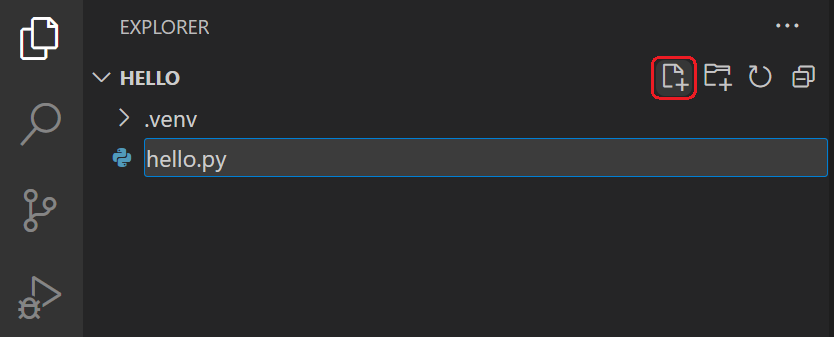
Name the file hello.py, and it automatically opens in the editor:
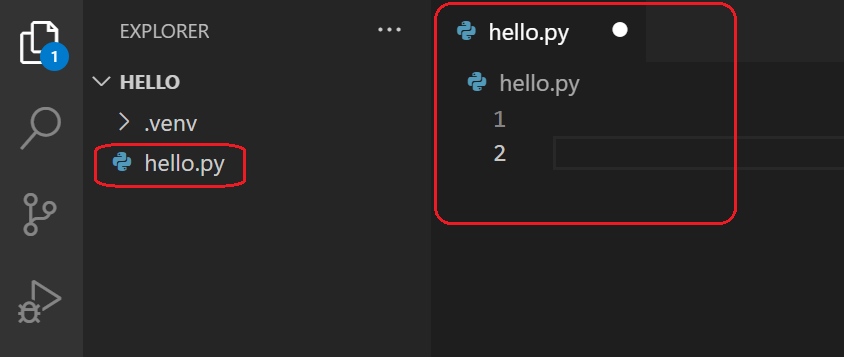
By using the .py file extension, you tell VS Code to interpret this file as a Python program, so that it evaluates the contents with the Python extension and the selected interpreter.
Next, start entering the following source code if using Python 3:
msg = "Hello World"
print(msg)
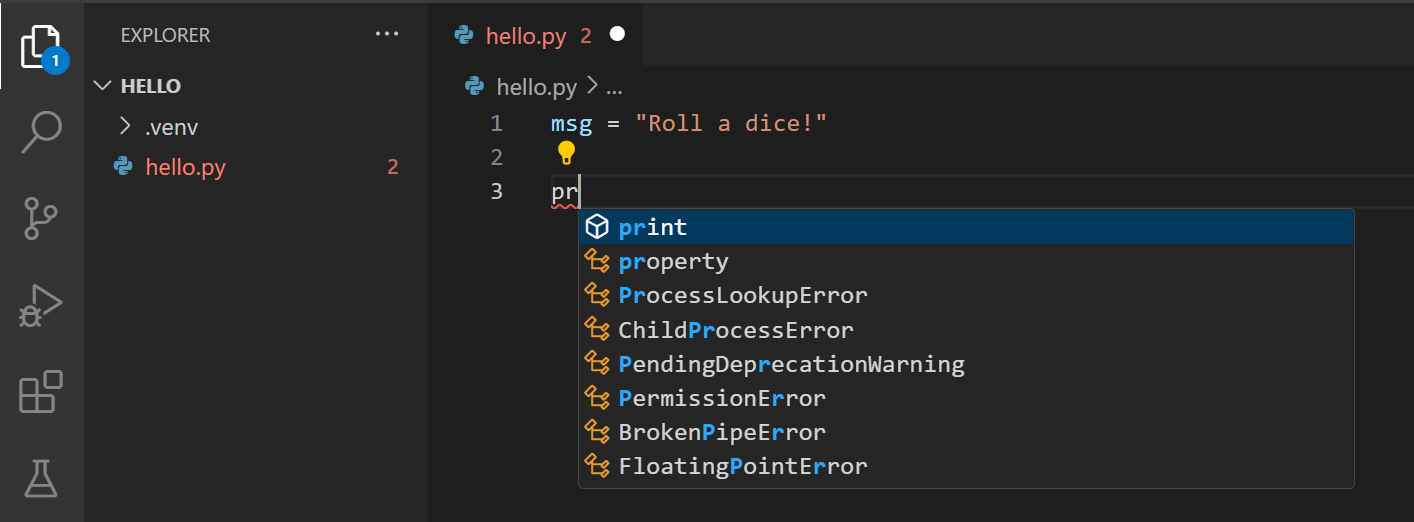
When you start typing print, notice how IntelliSense presents auto-completion options.
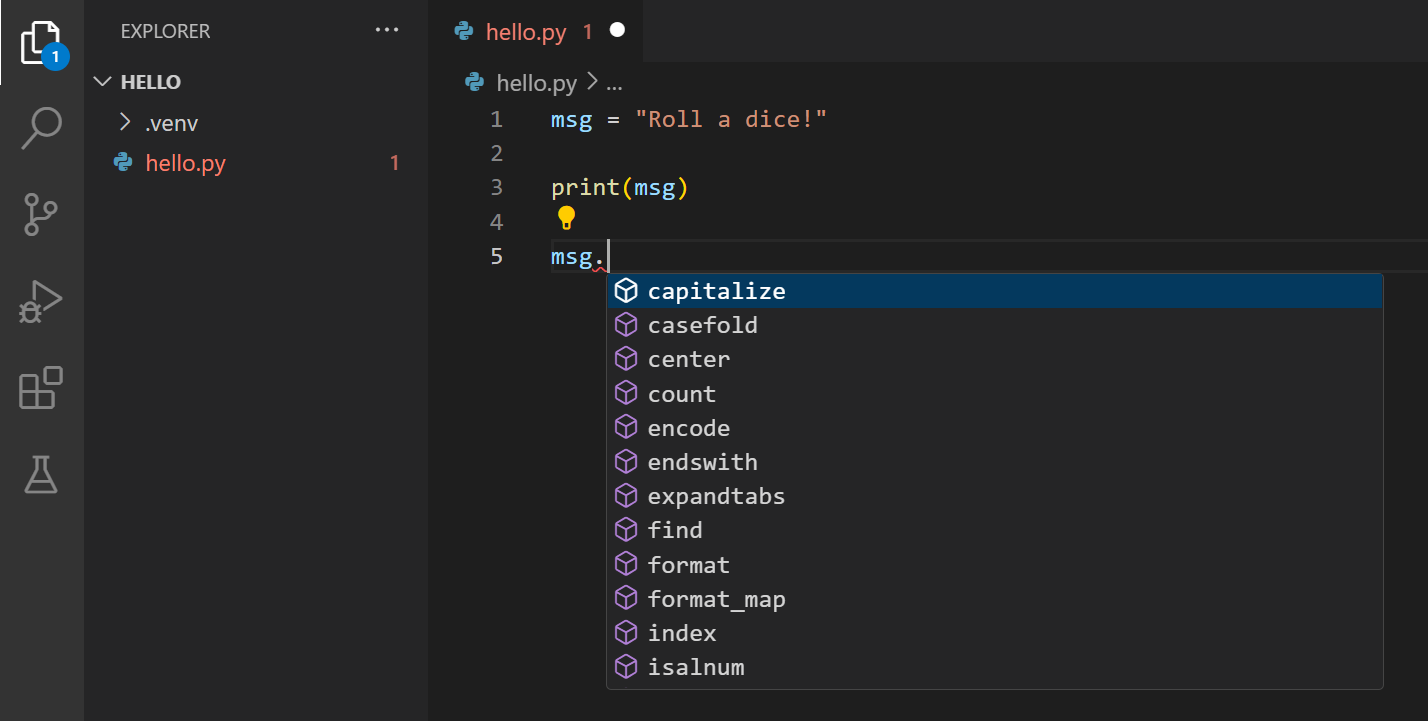
IntelliSense and auto-completions work for standard Python modules as well as other packages you've installed into the environment of the selected Python interpreter. It also provides completions for methods available on object types. For example, because the msg variable contains a string, IntelliSense provides string methods when you type msg.:
Feel free to experiment with IntelliSense some more, but then revert your changes so you have only the msg variable and the print call, and save the file (⌘S (Windows, Linux Ctrl+S)).
For full details on editing, formatting, and refactoring, see Editing code. The Python extension also has full support for Linting.
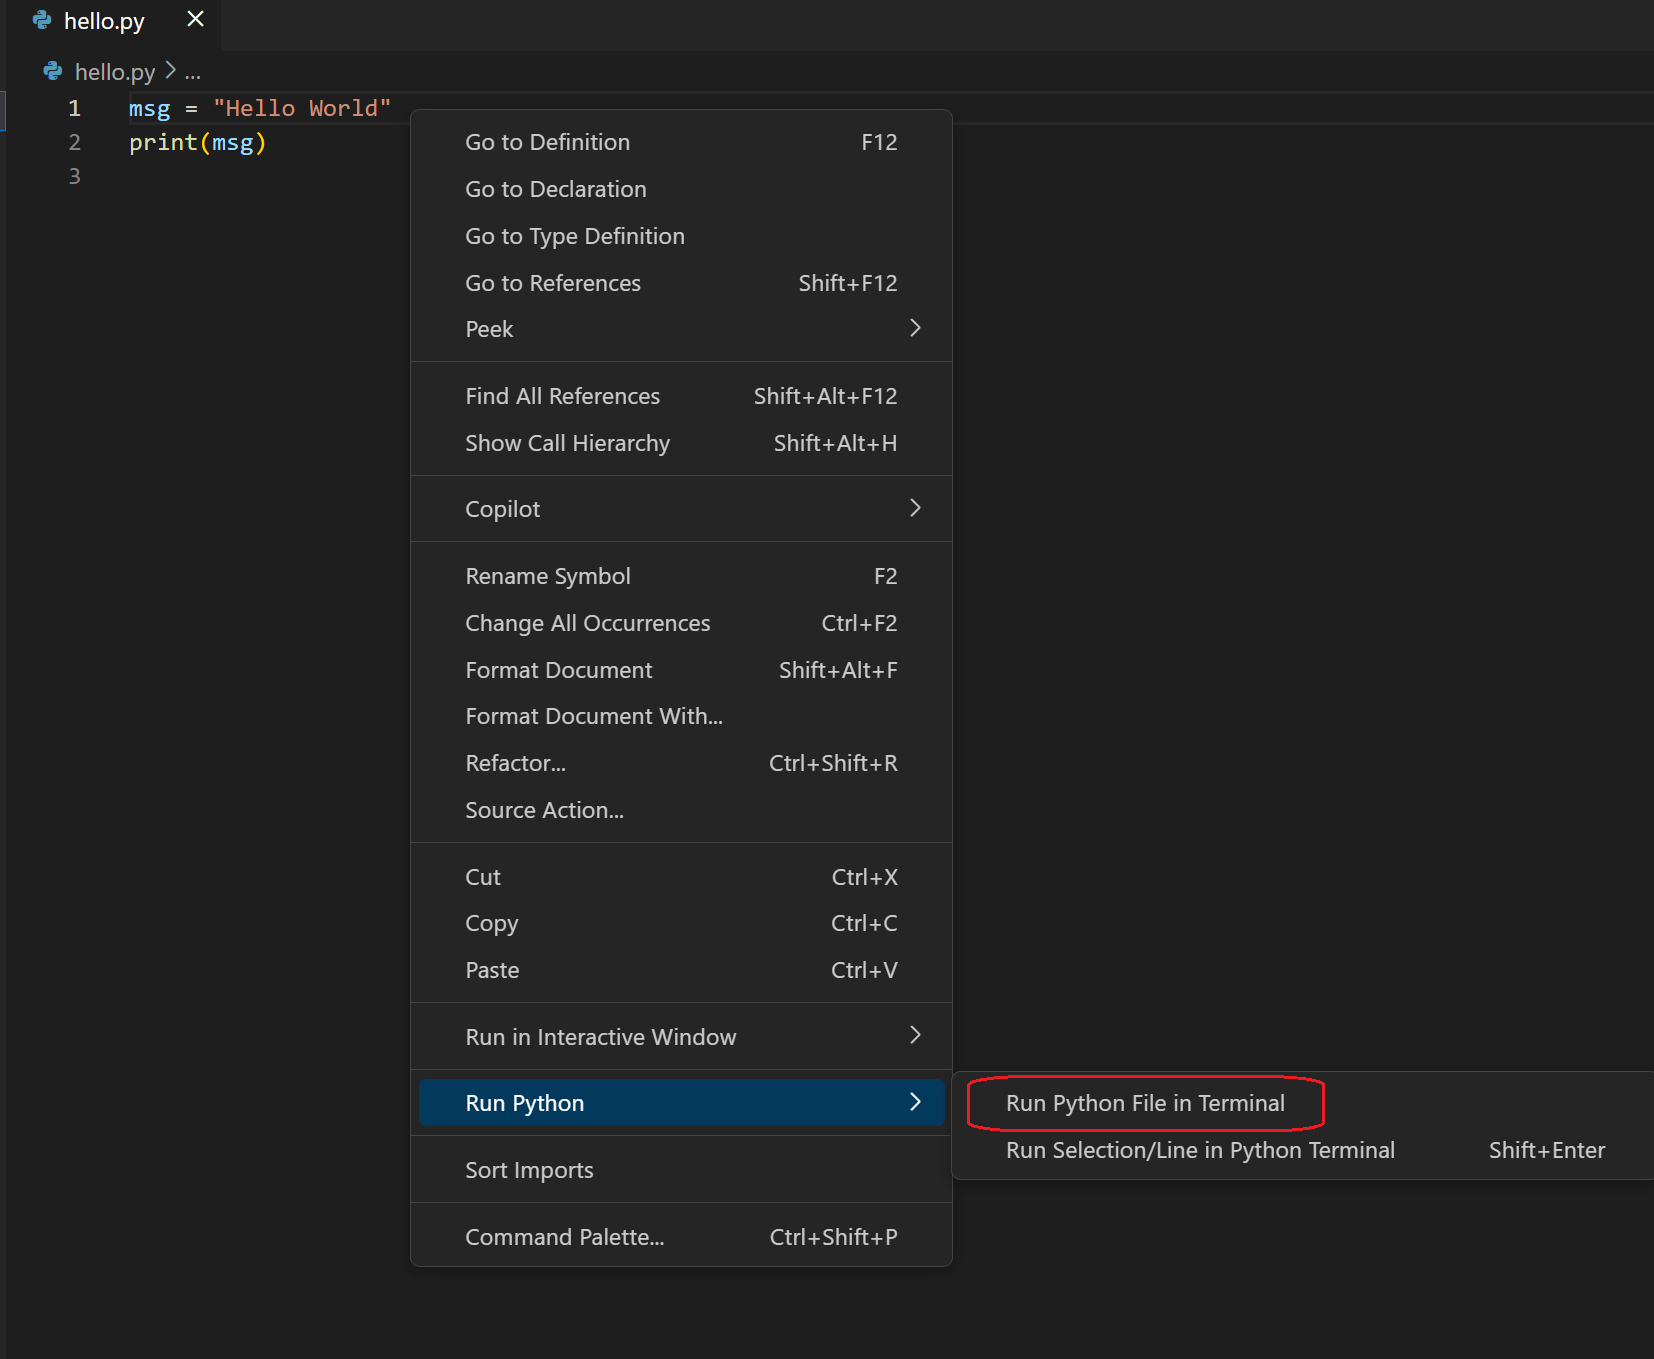
It's simple to run hello.py with Python. Right-click in the editor and select Run Python File in Terminal (which saves the file automatically):
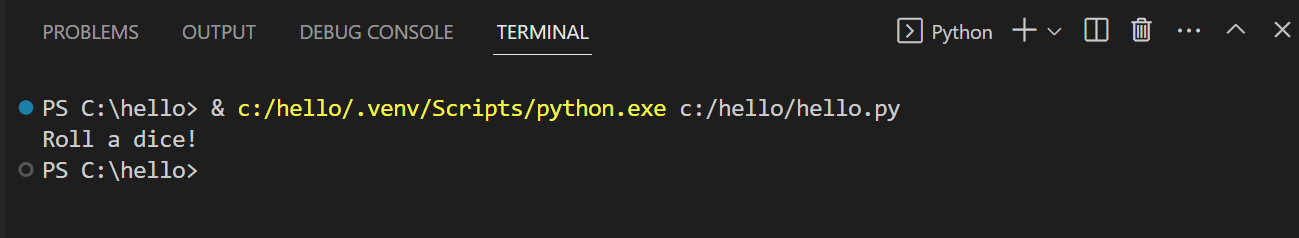
The command opens a terminal panel in which your Python interpreter is automatically activated, then runs python3 hello.py (macOS/Linux) or python hello.py (Windows):
There are two other ways you can run Python within VS Code:
Let's now try debugging our simple Hello World program.
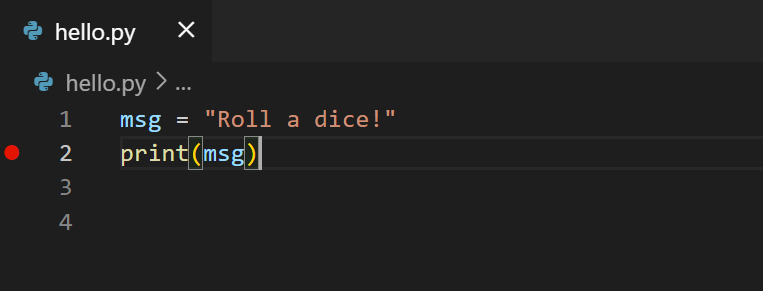
First, set a breakpoint on line 2 of hello.py by placing the cursor on the print call and pressing F9. Alternately, just click in the editor's left gutter, next to the line numbers. When you set a breakpoint, a red circle appears in the gutter.
Next, select the Debug View in the sidebar:
![]()
Then select the settings icon on the debug toolbar (or use the Debug > Open configurations menu command):

Selecting the settings icon automatically opens a configuration menu from the Command Palette, allowing you to select the type of debug configuration you would like for the opened file.

Note: VS Code uses JSON files for all of its various configurations; launch.json is the standard name for a file containing debugging configurations.
These different configurations are fully explained in Debugging configurations; for now, just select Python File, which is the configuration that runs the current file shown in the editor using the currently selected Python interpreter. Once selected the Python extension creates and opens a launch.json file that contains a pre-defined configuration based on your selection.
To automatically stop the debugger on the first line when the program starts, add a "stopOnEntry": true setting to the "Python: Current File" configuration in the generated launch.json file, so that the whole configuration appears as follows:
{
    "name": "Python: Current File",
    "type": "python",
    "request": "launch",
    "program": "${file}",
    "console": "integratedTerminal",
    "stopOnEntry": true
},
Save launch.json after making changes.
Tip: If you need to specify the exact folder containing the interpreter to use for debugging, include an entry for
pythonPathin the configuration, such as"pythonPath": "${workspaceFolder}"or"pythonPath": "${workspaceFolder}/.venv".
Tip: To specify command-line arguments for the Python program, add a line
"args": []to the configuration, and place each argument as elements inside the[]list. For examples, see Debugging - args.
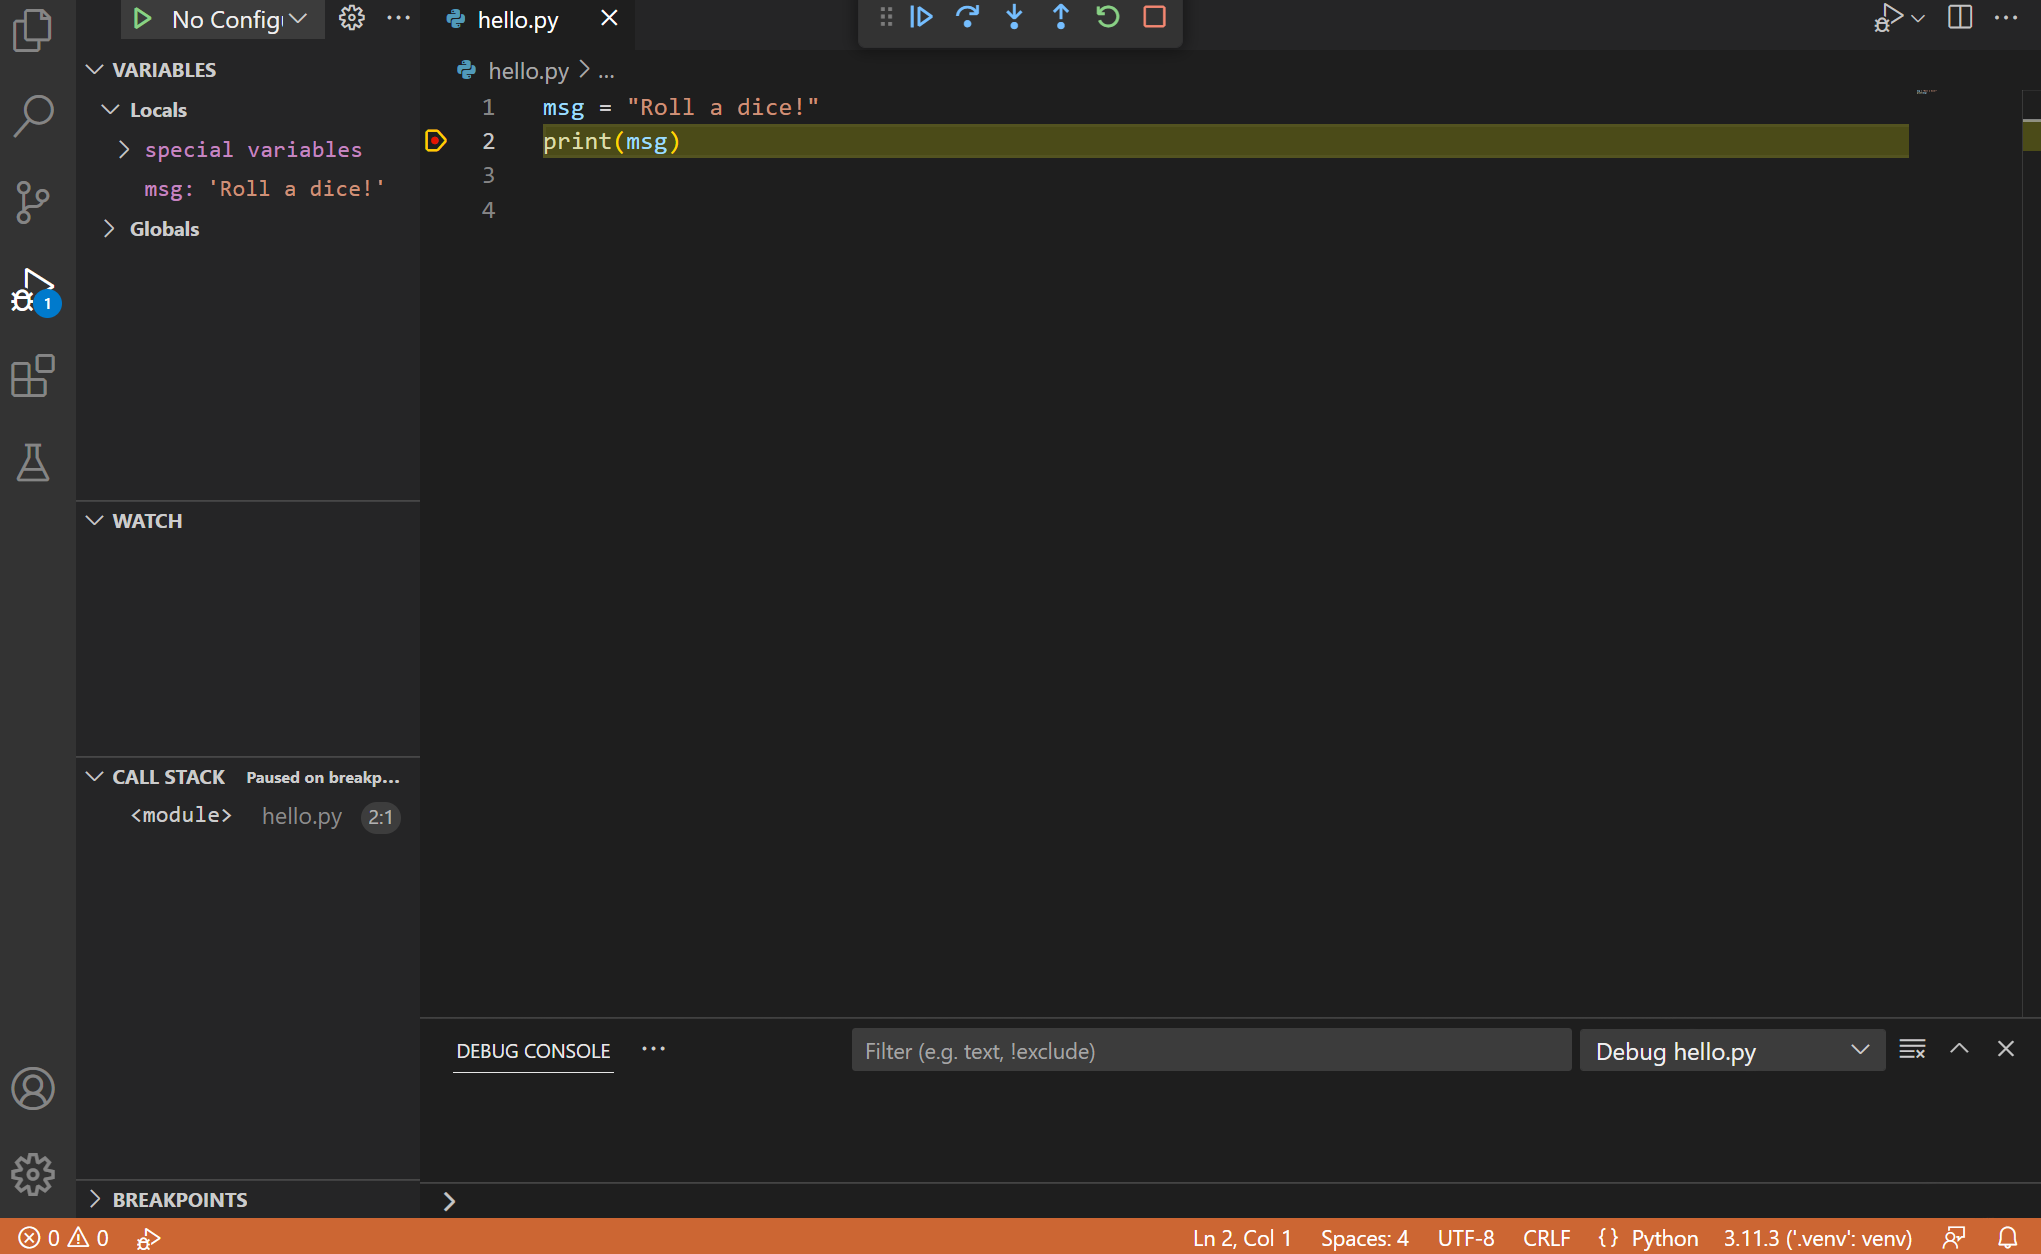
Switch to hello.py in the editor, then run the debugger by selecting the arrow in the Debug toolbar or pressing F5. The debugger stops at the first line of the file breakpoint (or the first line if stopOnEntry is set to true). The current line is indicated with a yellow arrow in the left margin. If you're stopped on the first line and examine the Local variables window at this point, you see that only automatic dunder variables are defined:
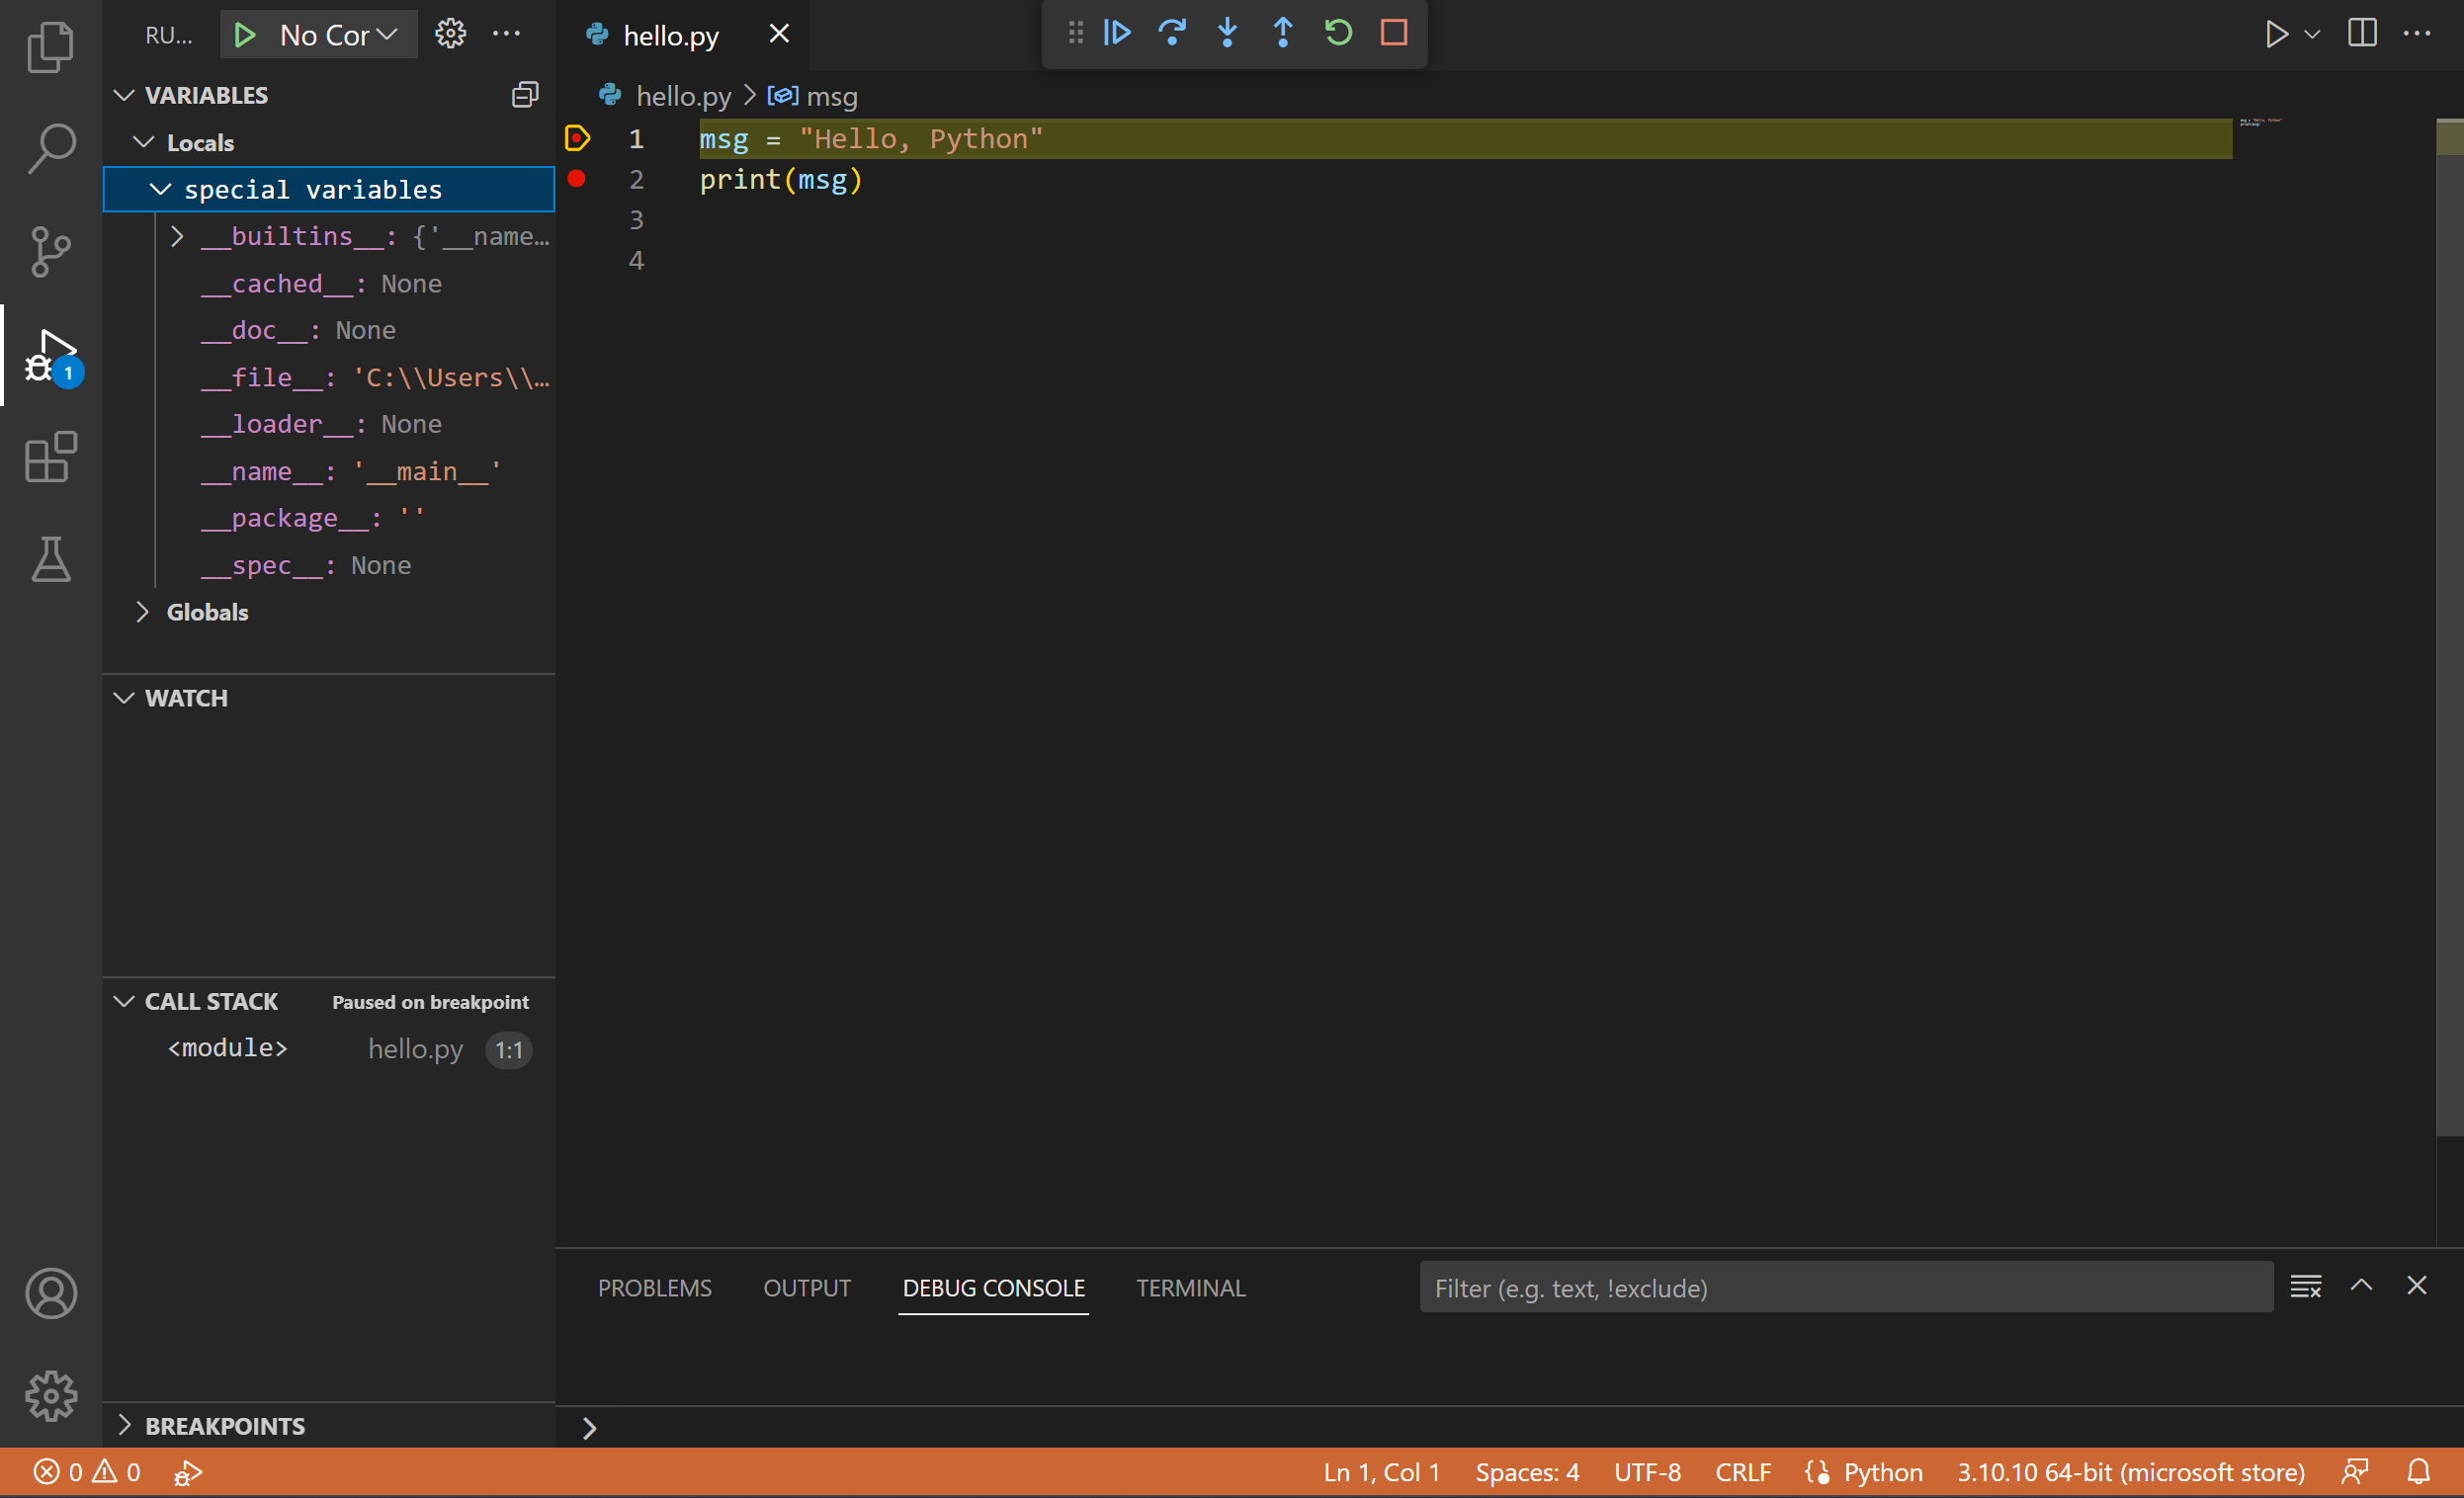
A debug toolbar appears along the top with the following commands from left to right: continue (F5), step over (F10), step into (F11), step out (⇧F11 (Windows, Linux Shift+F11)), restart (⇧⌘F5 (Windows, Linux Ctrl+Shift+F5)), and stop (⇧F5 (Windows, Linux Shift+F5)).

The Status Bar also changes color (orange in many themes) to indicate that you're in debug mode. The Python Debug Console also appears automatically in the lower right panel to show the commands being run, along with the program output.
To continue running the program, select the continue command on the debug toolbar (F5). The debugger runs the program to the next breakpoint. The now-defined msg variable appears in the Local pane.
Tip Debugging information can also be seen by hovering over code, such as variables. In the case of
msg, hovering over the variable will display the stringHello worldin a box above the variable.
You can also work with variables in the Debug Console (If you don't see it, select Debug Console in the lower right area of VS Code, or select it from the ... menu.) Then try entering the following lines, one by one, at the > prompt at the bottom of the console:
msg
msg.capitalize()
msg.split()

Select the blue Continue button on the toolbar again (or press F5) to run the program to completion. "Hello World" appears in the Python Debug Console if you switch back to it, and VS Code exits debugging mode once the program is complete.
If you restart the debugger, the debugger again stops on the first breakpoint, (or the first line is stopOnEntry is set to true, in which case the debugger stops before any code is run.)
To stop running a program before it's complete, use the red square stop button on the debug toolbar (⇧F5 (Windows, Linux Shift+F5)), or use the Debug > Stop debugging menu command.
For full details, see Debugging configurations, which includes notes on how to use a specific Python interpreter for debugging.
Tip: Use Logpoints instead of print statements: Developers often litter source code with
If for some reason VS Code doesn't generate launch.json for you, create the .vscode/launch.json file within the project folder (creating the .vscode folder if you need to), then paste the following contents into launch.json:
{
    "version": "0.2.0",
    "configurations": [
        {
            "name": "Python: Current File",
            "type": "python",
            "request": "launch",
            "program": "${file}",
            "console": "integratedTerminal"
        }
    ]
}
If you see "SyntaxError: invalid syntax" as shown below, you may have attempted to start debugging when launch.json was showing in the editor. The error occurs because launch.json is not Python code like hello.py:
    // Use IntelliSense to learn about possible attributes.
     ^
SyntaxError: invalid syntax
Select hello.py and try again. Alternately, create a debug configuration specifically for the hello.py file by adding the following lines in launch.json within the configuration array. Then select this configuration in the debugger drop-down and start the debugger again.
        {
            "name": "Python: hello.py",
            "type": "python",
            "request": "launch",
            "program": "${workspaceFolder}/hello.py",
            "console": "integratedTerminal"
        },
If you see the message, "Python interpreter is not found because python.exe is not in the workspace directory," or "You need to install a Python interpreter before you start debugging," then you may have pythonPath: ${workspaceFolder} in your launch.json file, but your Python interpreter actually exists in a different path. Check the value, or remove the pythonPath property altogether.
Let's now run an example that's a little more interesting. In Python, packages are how you obtain any number of useful code libraries, typically from PyPI. For this example, you use the matplotlib and numpy packages to create a graphical plot as is commonly done with data science. (Note that matplotlib cannot show graphs when running in the Windows Subsystem for Linux as it lacks the necessary UI support.)
Return to the Explorer view (the top-most icon on the left side, which shows files), create a new file called standardplot.py, and paste in the following source code:
import matplotlib.pyplot as plt
import numpy as np

x = np.linspace(0, 20, 100)  # Create a list of evenly-spaced numbers over the range
plt.plot(x, np.sin(x))       # Plot the sine of each x point
plt.show()                   # Display the plot
Tip: If you enter the above code by hand, you may find that auto-completions change the names after the
askeywords when you press Enter at the end of a line. To avoid this, type a space, then Enter.
Next, try running the file in the debugger using the "Python: Current file" configuration as described in the last section. (If you still have "stopOnEntry": true in that configuration, you need to select the run command again to continue.)
Unless you're using an Anaconda distribution or have previously installed the matplotlib package, you should see the message, "ModuleNotFoundError: No module named 'matplotlib'". Such a message indicates that the required package isn't available in your system.
To install the matplotlib package (which also installs numpy as a dependency), stop the debugger and use the Command Palette to run Terminal: Create New Integrated Terminal (⌃⇧` (Windows, Linux Ctrl+Shift+`))). This command opens a command prompt for your selected interpreter.
A best practice among Python developers is to avoid installing packages into a global interpreter environment. You instead use a project-specific virtual environment that contains a copy of a global interpreter. Once you activate that environment, any packages you then install are isolated from other environments. Such isolation reduces many complications that can arise from conflicting package versions. To create a virtual environment and install the required packages, enter the following commands as appropriate for your operating system:
Note: For additional information about virtual environments, see Environments.
Create and activate the virtual environment
For windows
py -3 -m venv env
env\scripts\activate
For macOS/Linux
python3 -m venv env
source env/bin/activate
Install the packages
# Don't use with Anaconda distributions because they include matplotlib already.

# macOS
python3 -m pip install matplotlib

# Windows (may require elevation)
python -m pip install matplotlib

# Linux (Debian)
apt-get install python3-tk
python3 -m pip install matplotlib
Select your new environment by using the Python: Select Interpreter command from the Command Palette.
Rerun the program now (with or without the debugger) and after a few moments a plot window appears with the output:

For additional examples of creating and activating a virtual environment and installing packages, see the Django tutorial and the Flask tutorial.
You can configure VS Code to use any Python environment you have installed, including virtual and conda environments. You can also use a separate environment for debugging. For full details, see Environments.
To learn more about the Python language, follow any of the programming tutorials listed on python.org within the context of VS Code.
To learn to build web apps with the Django and Flask frameworks, see the following tutorials:
There is then much more to explore with Python in Visual Studio Code: